


At Hyperverge, we provide AI-based solutions for identity verification (KYC), business verification (KYB), and anti-money laundering (AML) for various industries such as fintech, banking, insurance, financial services, digital lending, telecom, gaming, and e-commerce. Our solutions are used by enterprises like LinkedIn, Jio, Vodafone, SBI, and L&T Finance on a large scale, with over 750 million identity checks completed to date. Many major companies trust us to automate their customer onboarding processes and ensure compliance with regulations.
Logging is a vital part of any product, as it allows us to monitor the performance and behavior of the application and provides context for debugging when errors occur. We use the Elastic, Logstash, Kibana ( ELK ) platform for our logging needs. This is a write-up to share our experiences and learnings from maintaining an in-house ELK cluster. We will discuss how we optimized our logging setup to improve performance and reduce the cost of maintaining the system. Additionally, we will cover how we were able to migrate our ELK cluster from one cloud provider to another with minimal or zero downtime.
To start, we will delve into the different components of our logging system.
Logging Architecture
The logging setup consists of three primary components
- Collector
- Processor
- Backend to store the logs
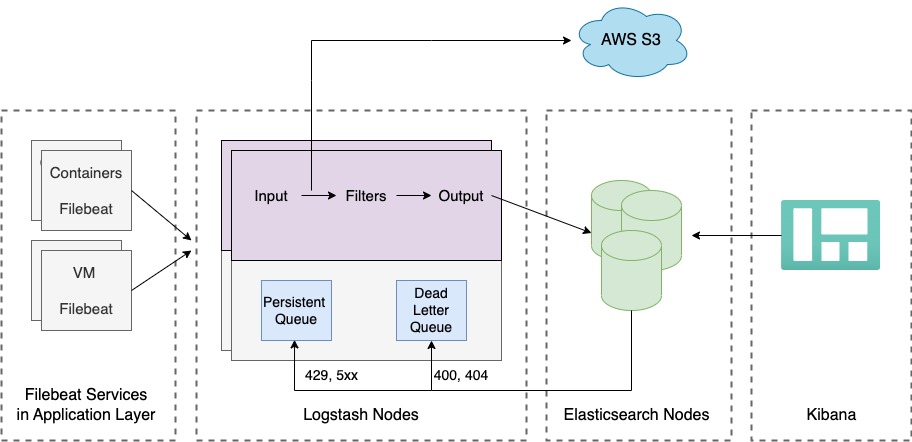
In our system, we use Filebeat to collect logs from various sources and send them to Logstash for further processing. Logstash serves as a central hub for all the logs, and we have enabled a persistent queue to ensure that logs are not lost if Elasticsearch, our backend, is unavailable or experiencing high demand. We also use a dead letter queue to store any logs that cannot be processed immediately, ensuring that they are not lost and can be addressed at a later time. We also send raw logs from Logstash to S3 for long-term storage. We will discuss this further in the blog.
There are three types of logs that are stored in the Elastic cluster
- Request/Response logs
- Application and Web server logs
- Heartbeat/Monitoring logs
Request/response logs are a vital part of our logging system and must be stored for the long term, as they contain information about API usage by customers. Application and web server logs are used for internal debugging and only need to be stored for a short period of time. Heartbeat/monitoring logs are primarily used for debugging and do not need to be retained for an extended period.
Growing Pains
The volume of data in our Elasticsearch cluster was causing it to struggle and experience frequent out-of-memory crashes. The cluster also took a long time to rebalance all the shards. To keep the cluster running smoothly, we had to upgrade the hardware frequently. However, it was clear that this setup was not sustainable. We conducted a review to identify the root cause of the problems and discovered that we had too many shards for the cluster to handle. We were hit with the problem of plenty.
“The problem of plenty”
We had approximately 3600 indices and 36000 shards. Elasticsearch recommends having 20 or fewer shards per GB of heap and we were having approximately 10x shards than the recommended value. We knew that we had to reduce the number of shards, so we began analyzing the data and the indices in the cluster to determine how to reduce the number of shards.
Remediation
We started with the monthly indices, which contained mostly the request/response logs. There was a separate index for each API that we provided to our customers. The number of indices started growing as we started introducing more APIs to our customers. The size of each index was proportional to the usage of the corresponding API. Many of the indices were smaller, ranging from 10 MB to 50 MB in size. We also discovered that we were creating 10 shards (5 primary and 5 replicas) for each index. We realized that it was excessive, as 10 shards are not necessary for indices that are within the range of 10 MB to 50 MB in size.
We analyzed the structure of the request and response logs and organized them based on certain categories, and instead of creating a separate index for each API, we created an index for each category. Then, we indexed the API into the appropriate category index based on which category it belongs to. We also started archiving the indices after a few months, but more on that later in this blog.
We then focused on the daily indices, which contained mostly application, web server, heartbeat, monitoring, and system logs. These indices were not necessary for long-term storage. Some of these indices, particularly the monitoring and system indices, were smaller in size (ranging from 5–20 GB). We decided to reduce the number of shards for these indices from 5 to 2.
With this, we were able to significantly reduce the number of indices to 100 and the number of shards to 300. This had a huge impact on the cluster, resulting in a reduction of more than 80% in the JVM. As a result, we were able to run the cluster with fewer hardware resources, leading to reduced costs for the ELK infrastructure.
Next, we started looking into the default settings of Elasticsearch to identify opportunities for optimization.
Elasticsearch Settings
Node delayed timeout
When a node leaves the cluster due to hardware failure, network connectivity, etc, the master node reacts by
- Promoting the replica to primary for all the failed primary shards on the node
- Allocating shards for the missing replicas
- Rebalance the shards
If there are any transient failures or network connectivity issues, the nodes generally return after some time. If the master node were to wait for a few minutes before taking any recovery action, it could reallocate the missing shards when the node rejoined the cluster, potentially saving a lot of rebalancing. The cost of rebalancing can be high, so it may be worth waiting longer to ensure that the failure is not transient. By default, the master node waits for 1 minute before taking any recovery action, but we increased this timeout to 5 minutes. The value can be set dynamically on the cluster.
PUT _all/_settings
{
“settings”: {
“index.unassigned.node_left.delayed_timeout”: “5m”
}
}
Index refresh interval
To make newly indexed documents searchable, Elasticsearch periodically refreshes its indices, by default every 1 sec. This process can be resource-intensive and may slow down indexing speed during heavy write traffic. To mitigate this impact, we increased the refresh interval for critical indices to 30 seconds.
PUT _all/_settings
{
“settings”: {
“index.refresh_interval”: “30s”
}
}
Collection of monitoring indices
The default interval for collecting monitoring data from Elastic, Logstash, and Kibana servers is 10s. We use the monitoring data to debug any performance issues or to find out the behavior of the cluster. To reduce the workload on the system, we changed the collection frequency to 1m. The following changes were made to each system to implement this change:
Elastic
xpack.monitoring.enabled: true
xpack.monitoring.collection.enabled: true
xpack.monitoring.collection.interval: 60s
Logstash
xpack.monitoring.enabled: true
xpack.monitoring.collection.interval: 60s
Kibana
xpack.monitoring.enabled: true
xpack.monitoring.min_interval_seconds: 60
We created an index template with these settings and ensured that all of these settings get applied to all the new indices.
{
“index_patterns” : [
“*”
],
“order”:0,
“settings” : {
“index” : {
“refresh_interval” : “30s”,
“unassigned” : {
“node_left” : {
“delayed_timeout” : “5m”
}
}
}
}
}
Data Tiering
To reduce hardware requirements and improve system performance, we decided to delete the data from Elasticsearch after three months. However, it was necessary to retain the data for auditing and compliance purposes. We considered using Elasticsearch’s snapshot feature, which allows us to store the backups of the cluster stored in Amazon S3, but ultimately rejected this idea due to two main drawbacks:
- Snapshots can only be used by Elasticsearch clusters
- Snapshots cannot be directly stored in the lower-cost Glacier storage tier.
We wanted to store the data in a format that can be used for other purposes. We decided to back up the raw logs from the logstash servers to s3. There were several options to transfer the data to s3
- Backing up the index to s3 just before deletion
- Using a cron job every 24 hours to push incremental data to S3
- Continuously pushing the data to s3 from the logstash layer
Given the large volume of data (index sizes of more than 500GB) and the need for a lower recovery point objective (RPO), the third option was chosen, which involves continuously pushing the logs to S3 in small batches with a maximum delay of 30 minutes. This ensures that all server logs are backed up in raw format in S3, with an RPO of 30 minutes.
This change allowed us to reduce the hardware requirements and improve system performance.
Migration of ELK stack between Cloud Providers
We needed to move our operations from one cloud provider to another. The reason for this migration was mainly based on cost considerations and the team’s familiarity with managing the infrastructure on a specific cloud provider.
We had the following requirements while migrating our cluster:
- Minimal downtime
- Ability to mirror logs from the old cluster to the new cluster to verify the functionality before the switchover, with a delay of 15-20 minutes being acceptable
- Downtime in the new cluster should not affect or put pressure on the older cluster
- No data loss during the transition from the old cluster to the new cluster.
Mirroring the logs between two ELK clusters
We added a pipeline to Logstash to transfer the raw logs to S3 using the S3 output filter plugin. To reduce costs, the logs were collected and sent to S3 in batches, with a maximum file size of 100MB or a maximum duration of 30 minutes, whichever occurred first. This ensured that the accumulation of logs did not fill up the disk while also ensuring that the logs were transferred to S3 in a timely manner.
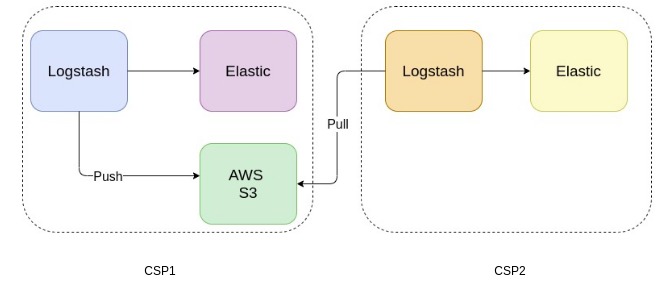
We created a separate logstash node in the new cluster to pull the logs from s3 using the logstash s3 input filter plugin. Once the plugin was configured, the new logstash cluster was automatically able to pull the files from s3 pushed from the old logstash cluster. This allowed us to test the new setup with production logs and ensure that the latencies of the new pipelines in the Logstash filter were within acceptable limits.
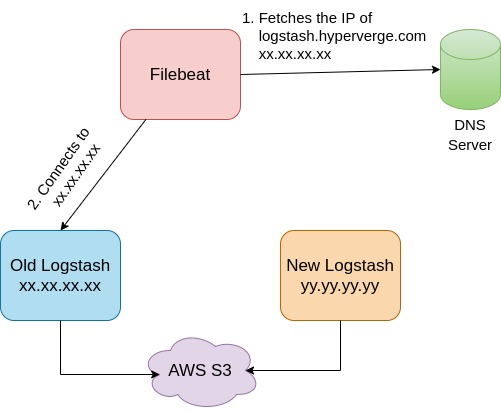
The Cutover
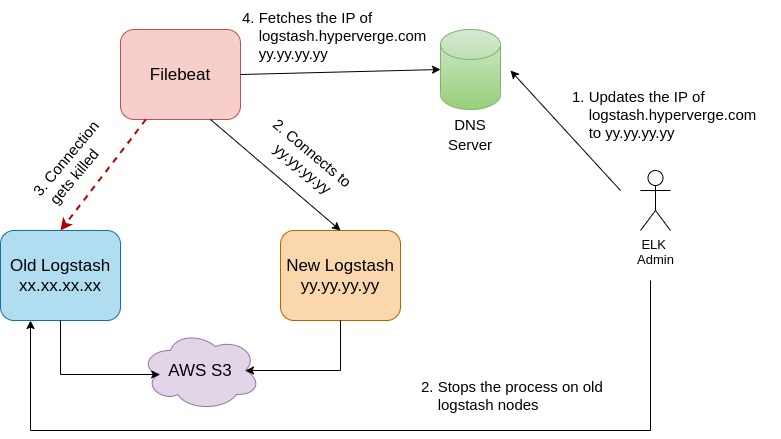
The Filebeat processes running on production VMs were configured to send logs to the Logstash cluster through a DNS entry. To migrate the logs to the new logstash cluster, we updated the DNS entry to point to the load balancer of the new logstash cluster. However, the Filebeat processes use the lumberjack protocol, which creates a persistent connection to the Logstash node. In order to force the Filebeat processes to establish a new connection to the new Logstash cluster, we stopped the Logstash processes on the old machines, which caused the Filebeat processes to attempt to reconnect and resolve the DNS entry to the new Logstash cluster.
To prevent any data loss during the transition phase, we gradually restarted the logstash processes on all the old machines. This ensured that remaining log files on the old logstash machines were pushed to s3.
During the cutover,
Metrics to monitor during the cutover
We enabled xpack monitoring on the ELK cluster. It allowed us to monitor the traffic flow through the new Logstash cluster and the overall increase in the connections in the logstash machines. Using the Kibana setup, we were also able to see the records that were ingested into Elasticsearch.
When it comes to agile software development, it’s recommended to use a seamless project management tool for enhancing collaboration and efficiency within lean engineering teams and product managers.
Parting Words
Through this process of fine-tuning and optimization, we were able to significantly reduce the memory consumption and hardware requirements for running the cluster and gained valuable insights into administering and maximizing the performance of the Elasticsearch cluster.
PS: If you’re interested in being a part of such innovative projects, HyperVerge is hiring! Check out the open positions and apply here.